Understanding Trade Areas: A Practical Guide for City Planners

In today’s competitive environment for retail attraction, understanding your trade area isn’t a luxury—it’s a necessity. Cities hoping to land national and regional retailers must be prepared to answer one essential question:
Who shops here, and why?
This article breaks down what city planners and economic development teams need to know about defining and using trade area data to position their communities for retail investment.
What Is a Trade Area?
A trade area is the geographic zone from which a retail location draws most of its customers. It’s not limited to city boundaries or zip codes—it’s shaped by drive times, road access, natural barriers, and even shopping preferences.
Retailers and site selectors use trade area definitions to assess customer volume, spending power, and behavior. If you want to compete for their attention, you need to understand your trade area as well—or better—than they do.
Three Common Types of Trade Areas
1. Radius-Based Trade Areas
This approach draws a circle around a site (e.g., 3 or 5 miles). While easy to visualize, it often misses key real-world factors like highways, rivers, or retail competitors.
2. Drive-Time Trade Areas
A more accurate method, this reflects the area someone can reach by car in a set time (e.g., 10 or 15 minutes). This format is widely used by national retailers evaluating new sites.
3. Custom or Behavioral Trade Areas
Using mobile device data or loyalty program insights, these areas reflect actual shopper movement and habits. While more complex to build, they are incredibly effective in validating demand and reach.
Why Trade Area Precision Matters
Retailers aren’t just looking at your city’s population—they’re analyzing the broader picture. If your proposal doesn’t align with how they define customer reach, you risk:
- Underestimating your market potential
- Missing opportunities to highlight regional pull
- Falling behind better-prepared peer cities
By clearly defining your trade area and supporting it with up-to-date data, you give your city a stronger, more credible retail recruitment strategy.
Tips for City Planners: Making Trade Area Data Actionable
✅ Use Drive-Time Over Radius
Drive-time areas better reflect real shopper behavior and commuting patterns.
✅ Compare to Peer Markets
Benchmarking helps retailers assess your competitiveness and growth potential.
✅ Quantify Retail Leakage
Show how much local spending is going elsewhere—and how your city can capture it.
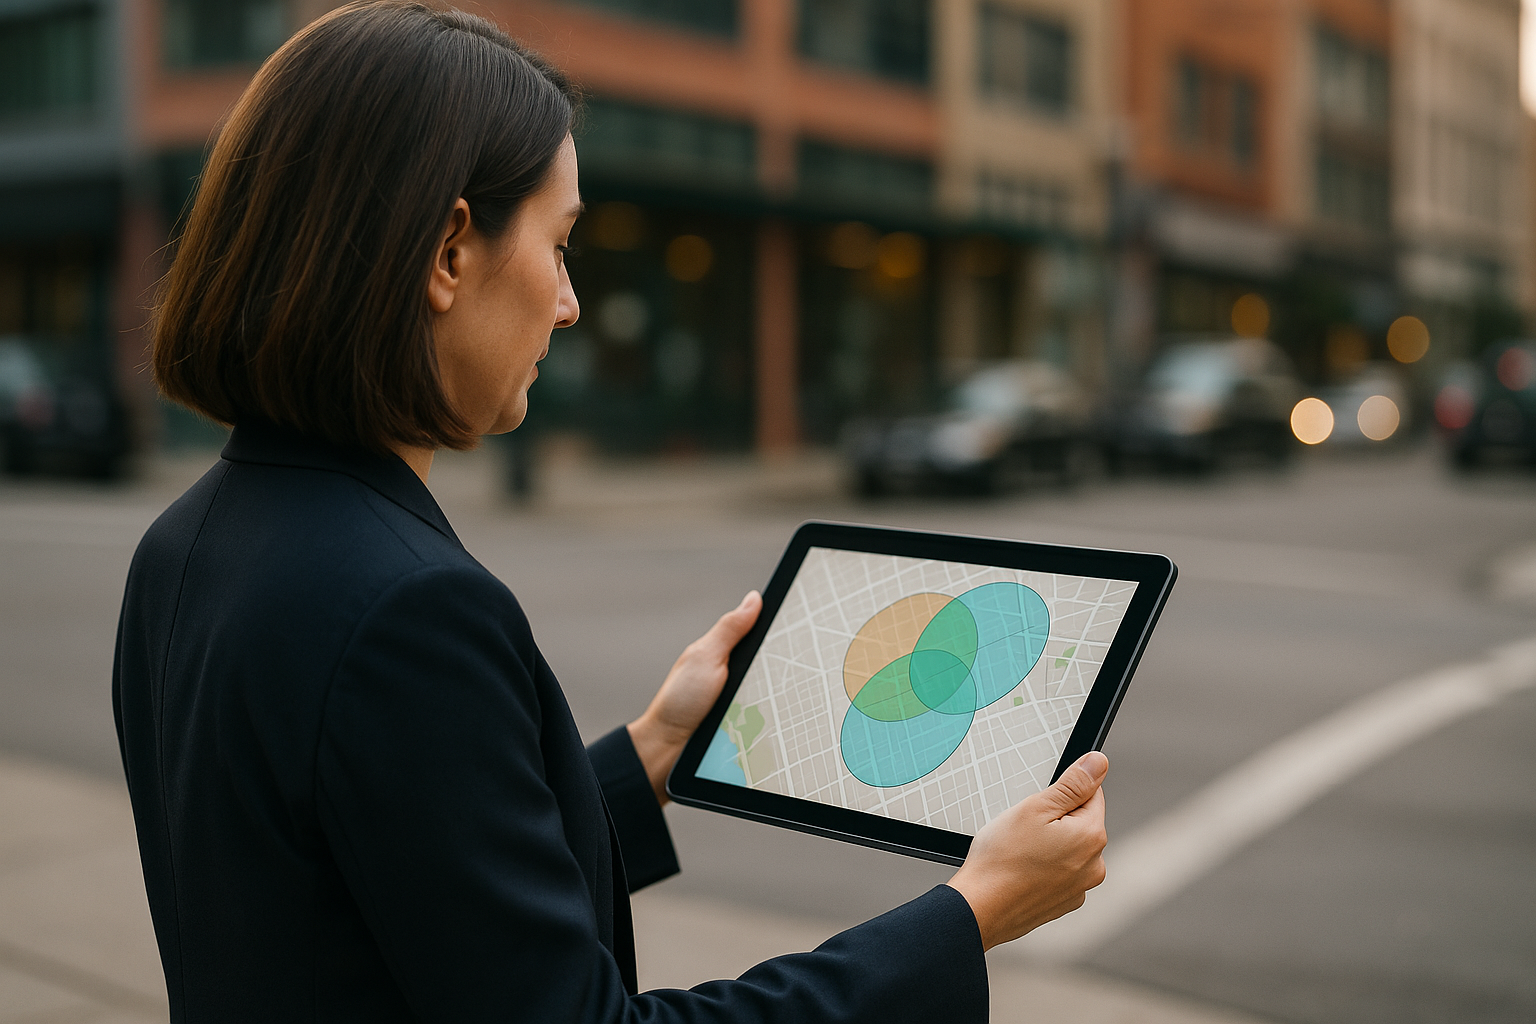
✅ Use Visuals to Tell the Story
GIS maps and demographic dashboards are more persuasive than spreadsheets.
✅ Reevaluate Regularly
Your trade area shifts as your city grows—new developments, roads, and consumer behavior all affect the picture.
Why Trade Area Analysis Works
Cities across the U.S. are elevating their pitch by embracing more advanced trade area modeling. Some use mobile data to show true shopper behavior. Others highlight overlooked drive-time markets that cross municipal boundaries.
The most successful cities don’t wait for retailers to ask—they present the data upfront, with clear visuals and clear opportunity.
This level of preparation not only increases your odds of attracting high-quality retail—it also builds trust with brands and brokers looking for serious partners.
Final Takeaway: Know Your Trade Area, Tell Your Story
Defining and understanding your trade area is one of the most powerful steps a city can take to improve its retail development outcomes. It's not just about showing growth—it's about showing the right kind of growth in the right place.
Want to attract retailers with confidence?
Download our free guide:
Building Competitive Retail Markets: A Municipal Playbook
This practical resource includes tips on how to define your trade area, present your city's strengths, and stand out in a crowded field of competing municipalities.
Ready to Elevate Your Strategy?
Schedule a consultation today to discuss your project and see how we can help you achieve your goals.
Stay Updated with CRE 360
Get the latest insights and updates from CRE 360 in your inbox.


