

In today’s competitive retail environment, selecting the right site is a high-stakes decision. The wrong location can derail revenue projections and delay market growth. While most retailers now incorporate data into their process, the difference between success and stagnation often lies in how well that data is structured, synthesized, and applied.
Modern site selection models go far beyond demographics or broker input. They integrate layered datasets—mobility trends, lifestyle segmentation, competitive mapping—into a unified strategy that drives confident, profitable decisions.
Fixed-radius trade areas (3-mile, 5-mile) offer limited insight into real consumer behavior. Today’s models define trade areas based on drive times, walkability, and behavioral clusters, offering a more precise view of true customer reach.
Application: A grocer evaluating two suburban sites could compare weekday traffic from nearby employment centers. Mobile location data may reveal that one site draws heavy lunch traffic—an insight a static map wouldn’t show.
Tools used: ESRI Business Analyst, MapInfo, Placer.ai
Basic population stats aren’t enough. Psychographics and lifestyle segmentation reveal why people shop, how often, and where.
Example tools: Claritas PRIZM and Nielsen Segmentation sort consumers into lifestyle groups that align with retail behaviors—ideal for tailoring store formats and merchandising strategies.
Data-driven models account for surrounding retailers and potential cannibalization of your existing stores. Retailers use gravity models or market share forecasting to simulate trade area overlaps.
Application: A restaurant brand comparing multiple sites might model expected trade area overlap to avoid eroding traffic from an existing location.
Using mobile device data, retailers now map dwell times, foot traffic patterns, and directional flows. This helps determine if a location supports quick visits, lingering shoppers, or peak-hour volume.
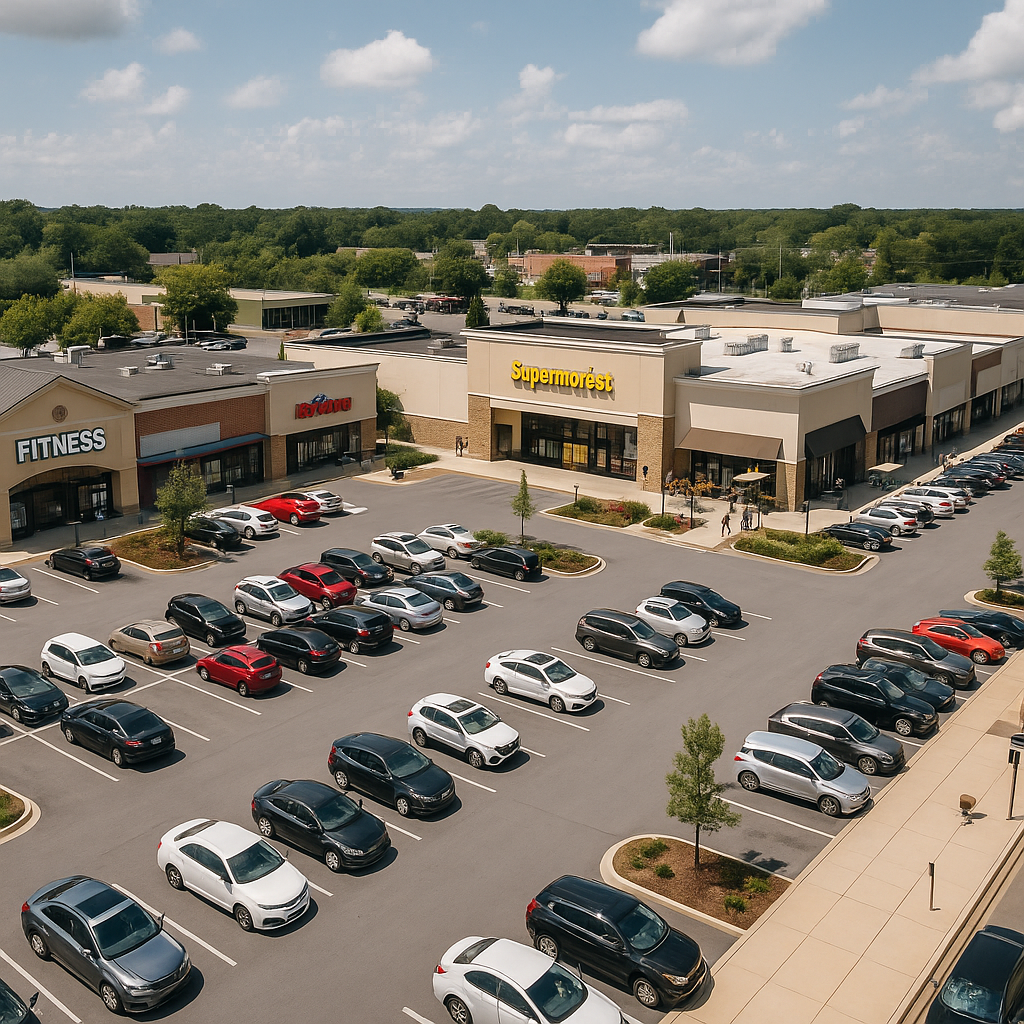
Stat to know: According to Placer.ai’s 2024 report, shopping centers with complementary co-tenancy (like fitness + coffee + grocery) experience up to 22% longer visit durations.
Advanced site selection models forecast performance before a lease is signed. Inputs include:
Outputs may include:
Weighted scorecards help retail teams objectively compare candidate sites based on brand-specific criteria such as rent, access, visibility, and tenant synergy. Visual dashboards or GIS heatmaps are often used to prioritize options.
Application: A retailer planning regional expansion could assign scores to 8 locations and quickly narrow to the top 3 based on total weighted impact.
Strong analytics lose impact without strong presentation. Retailers use dashboards, maps, and scenario models to help real estate, finance, and operations align on decisions quickly.
The result: faster executive sign-off and reduced friction between departments.
Even sophisticated models can mislead if applied incorrectly:
Retailers often combine platforms to form their decision stack:
These tools help bring demographic, behavioral, and market data into one decision-making framework.
Even with strong internal teams and access to quality data, many retailers face gaps in turning insight into action. That’s where an experienced external partner can deliver real advantage—not just by connecting the data, but by guiding strategy, refining execution, and ensuring alignment across departments.
At CRE 360, we help clients at every stage of the site selection process:
Whether you’re entering a new market or optimizing your national rollout, expert support ensures your team moves forward with clarity, confidence, and competitive precision.
A well-structured, data-driven site selection model doesn’t just help you choose—it helps you lead. It cuts risk, supports stakeholder buy-in, and positions your brand for sustainable growth.
📥 Ready to elevate your site selection strategy? Request an Expert Review
Stay informed with our expert articles and resources.

May 13, 2026
Kevin Bissell
Here's how leading landlords are transforming single leases into ecosystem advantages.
Read More
.svg)

May 13, 2026
Kevin Bissell
This comprehensive guide shows how to transform site validation from a defensive checkpoint into an offensive weapon that wins prime locations.
Read More
May 13, 2026
Kevin Bissell
This article outlines how to assess your current mix, identify retail gaps, and execute leasing strategies that build long-term value.
Read More
© 2026 CRE360 Partners. All rights reserved.
